
About
What are we doing and how are we doing it?
What are we doing and how are we doing it?
First, and perhaps most importantly, we are assembling a data system of publicly available information relating to extractive activities and their ecological and social surroundings.
Of course, that then necessitates access to that data, so we are developing user-friendly navigation tools. No need to learn any programming or query languages — if you can turn on a computer you can access our data!
Ask a plain English question in our natural language query tool and you'll be routed to relevant information in our data system, complete with citations and — where possible — links to the full source text.
If it's a region you're interested in, you can browse the spatial explorer and view by municipality, ecoregion, species range and many other pre-set boundaries. Or you can draw your own polygons and customize your data that way.
Watch the video or scroll to learn more
To illustrate our process we are here using Sesame Street as a fun, neutral, and - of course - fictional place. We are developing PanEcology using real-life places.
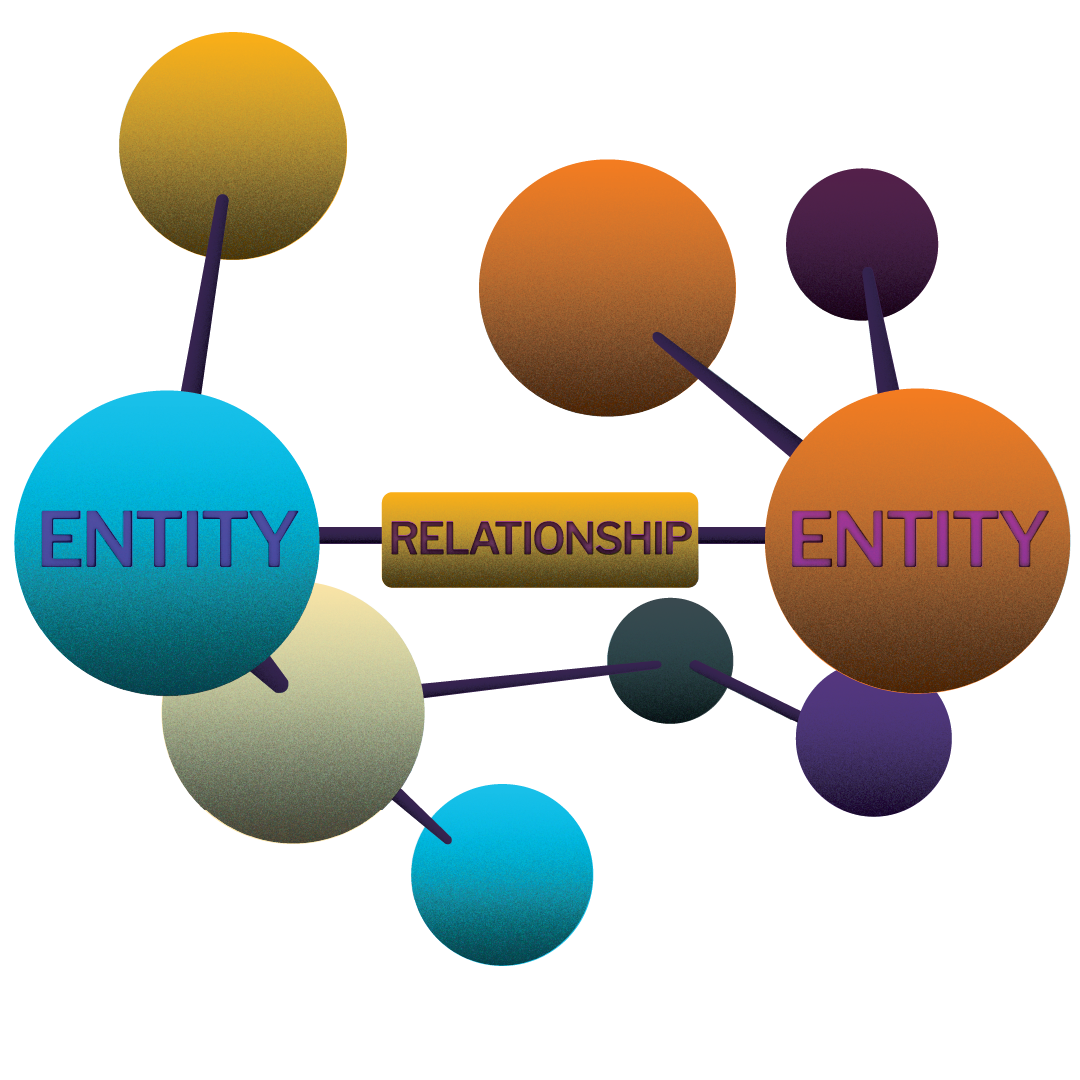
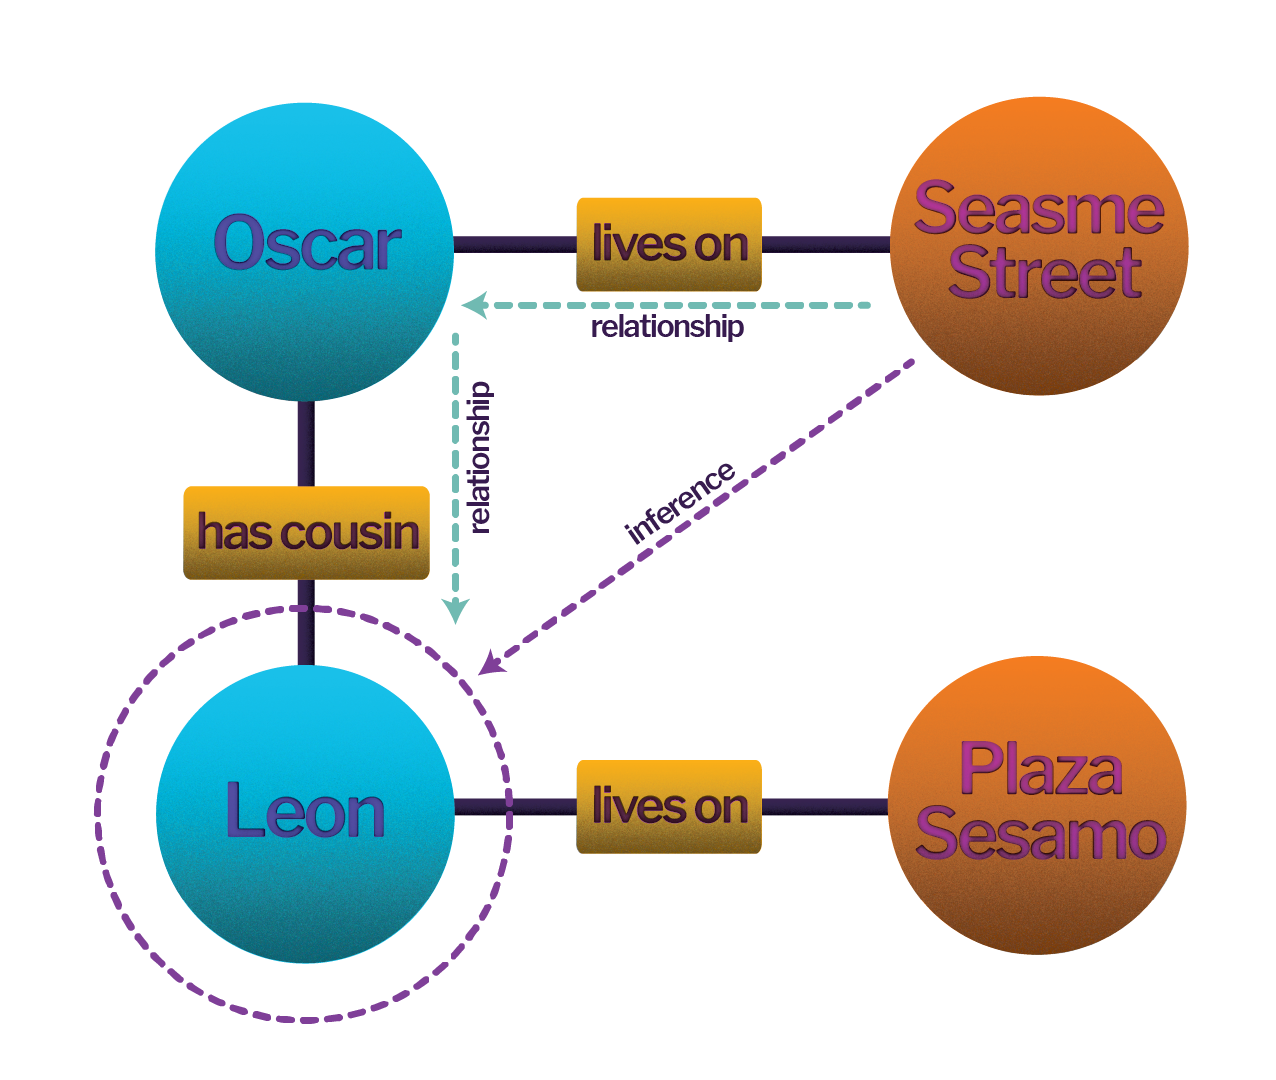
First, we create an ontology where everything is related in groups called ”triples”. A triple is a group of two "entities"- which are any objects represented in the ontology - with a predefined relationship between them. The relationship is explicitly recorded in the ontology.
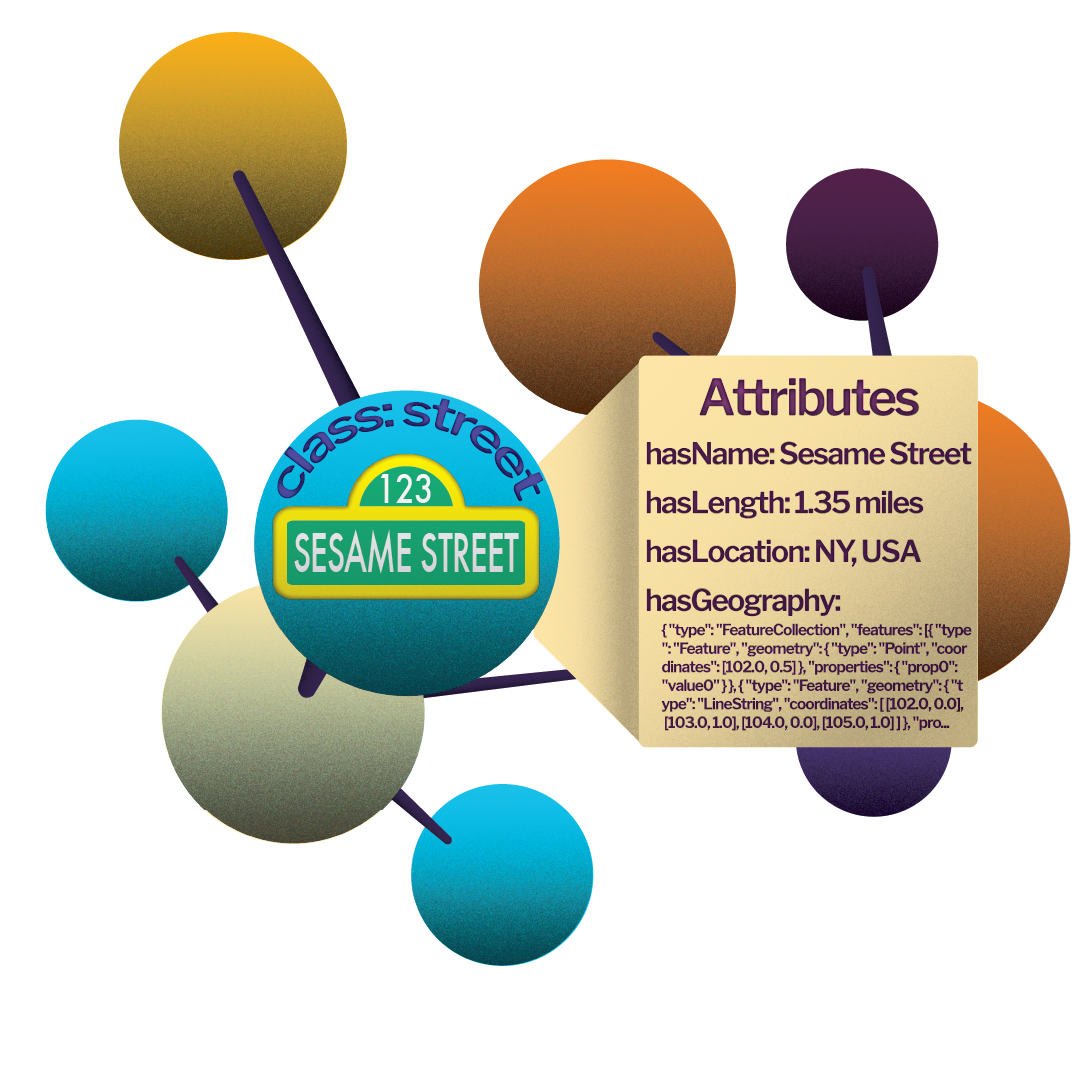
Entities also have "classes", within which they fall. You can think of a class as the "type" of object the entity is. Each class has a group of attributes associated with it, the fields of which will be the same across all members of the class, but whose values may vary.
The structure that is created when numerous entities are linked in this way is called a knowledge graph.
Knowledge graphs have certain advantages over more traditional database structures. For our purposes, the most important of these include the combination of disparate data sources, machine understandability, and subsequently, machine inference.
Inference is the ability to extrapolate facts that aren't explicitly stated in the database, based on data and relationships that are specifically encoded. This allows us to perform more insightful queries than traditional databases.
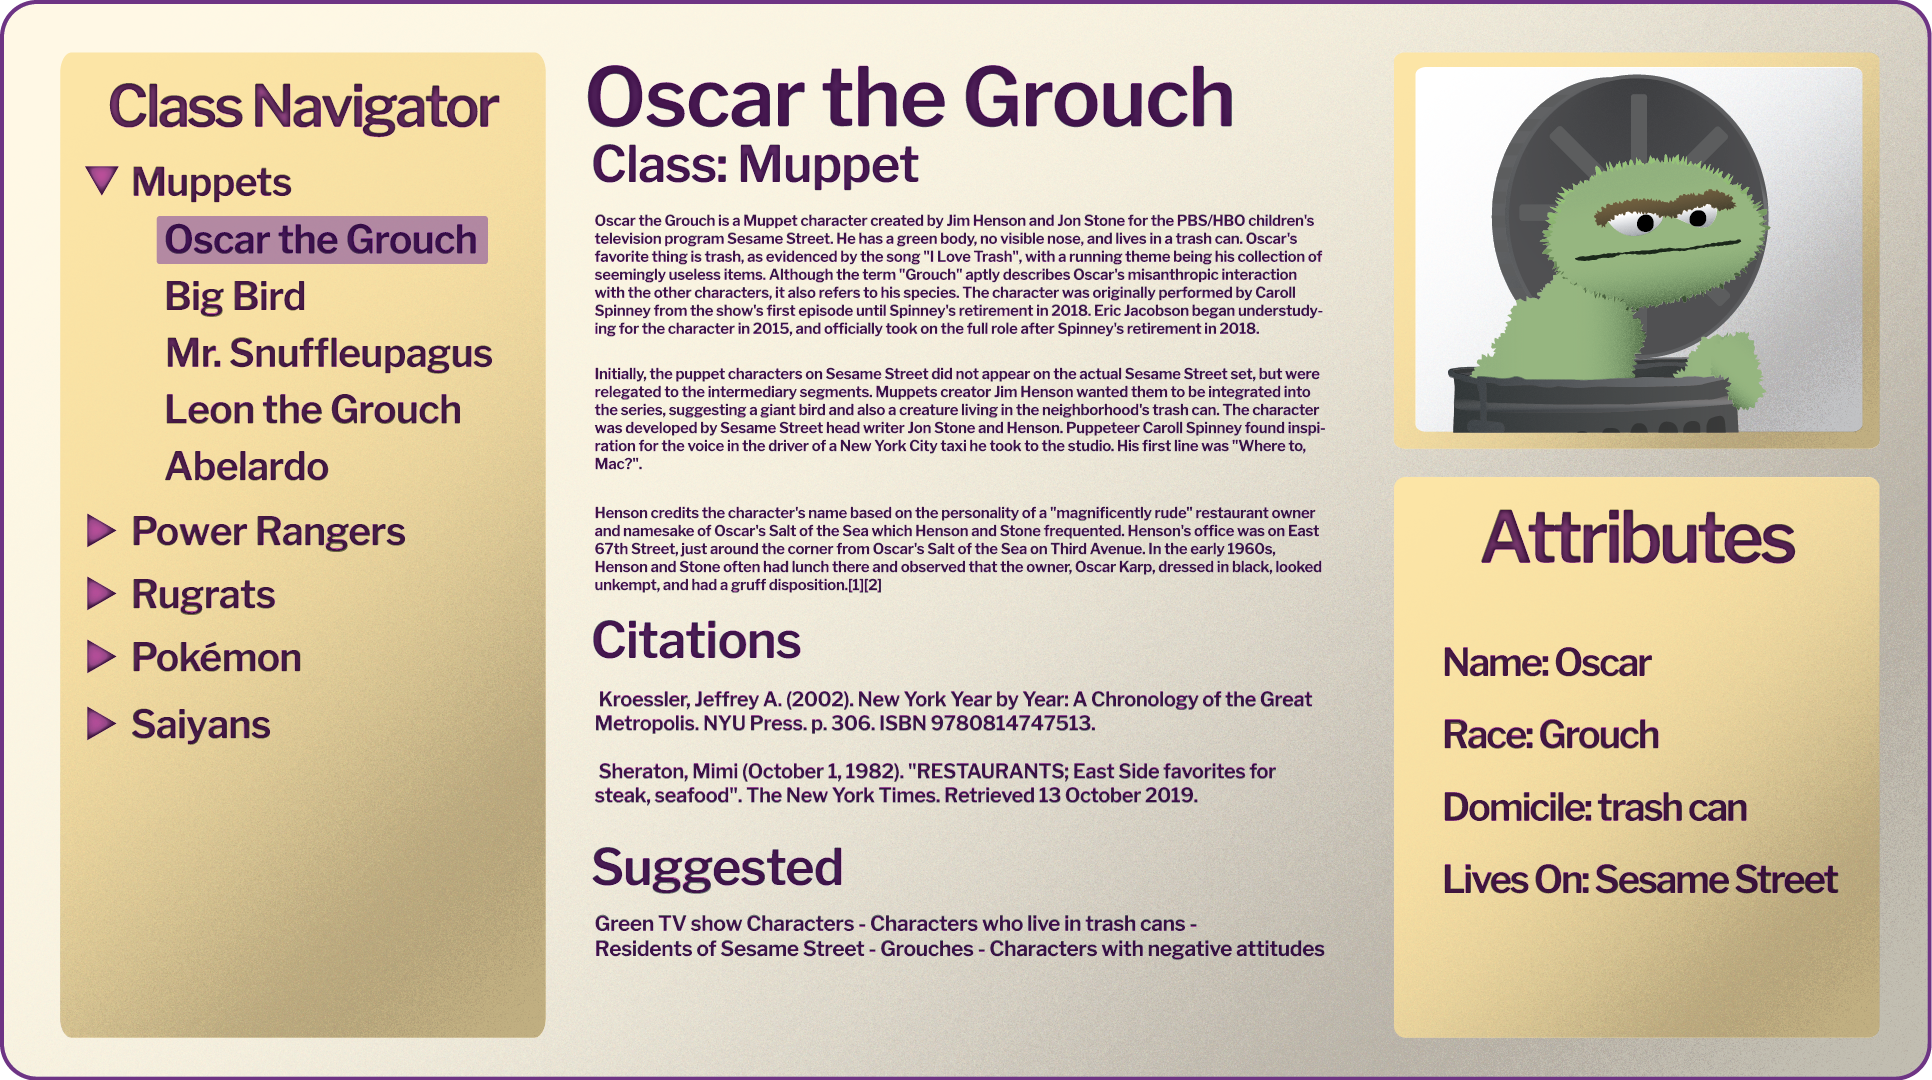
The data for a knowledge graph must live somewhere, and we will be hosting ours on a linked data media wiki. This lets us create templates for classes and link entities easily using markdown. This also lets users easily intuit navigation of the wiki.
Usually, knowledge graphs sacrifice human usability for machine readability. By tying our knowledge graph and wiki so close together we can make our data machine-readable yet easily accessible to any curious human.
Currently, querying databases requires knowledge of query languages that aren't practical to learn for many users. You also have to know in detail how the specific database you're querying is organized. We are working on writing the software to simply ask the database a question in plain English and receive an accurate answer, as well as proposed paths of information you may also want to pursue.

A large language model(LLM) will be trained on our database so that it "knows" what's in there.
When you ask a plain language question, the LLM will create a corresponding query in the appropriate language so you don't have to!
That query is then executed against our database, and the results are served to the user like this.
It is important to note that the LLM is used only to formulate the query and to make the data human-readable. Information is pulled from our database of rigorously vetted and well-sourced data. This minimizes AI hallucination.
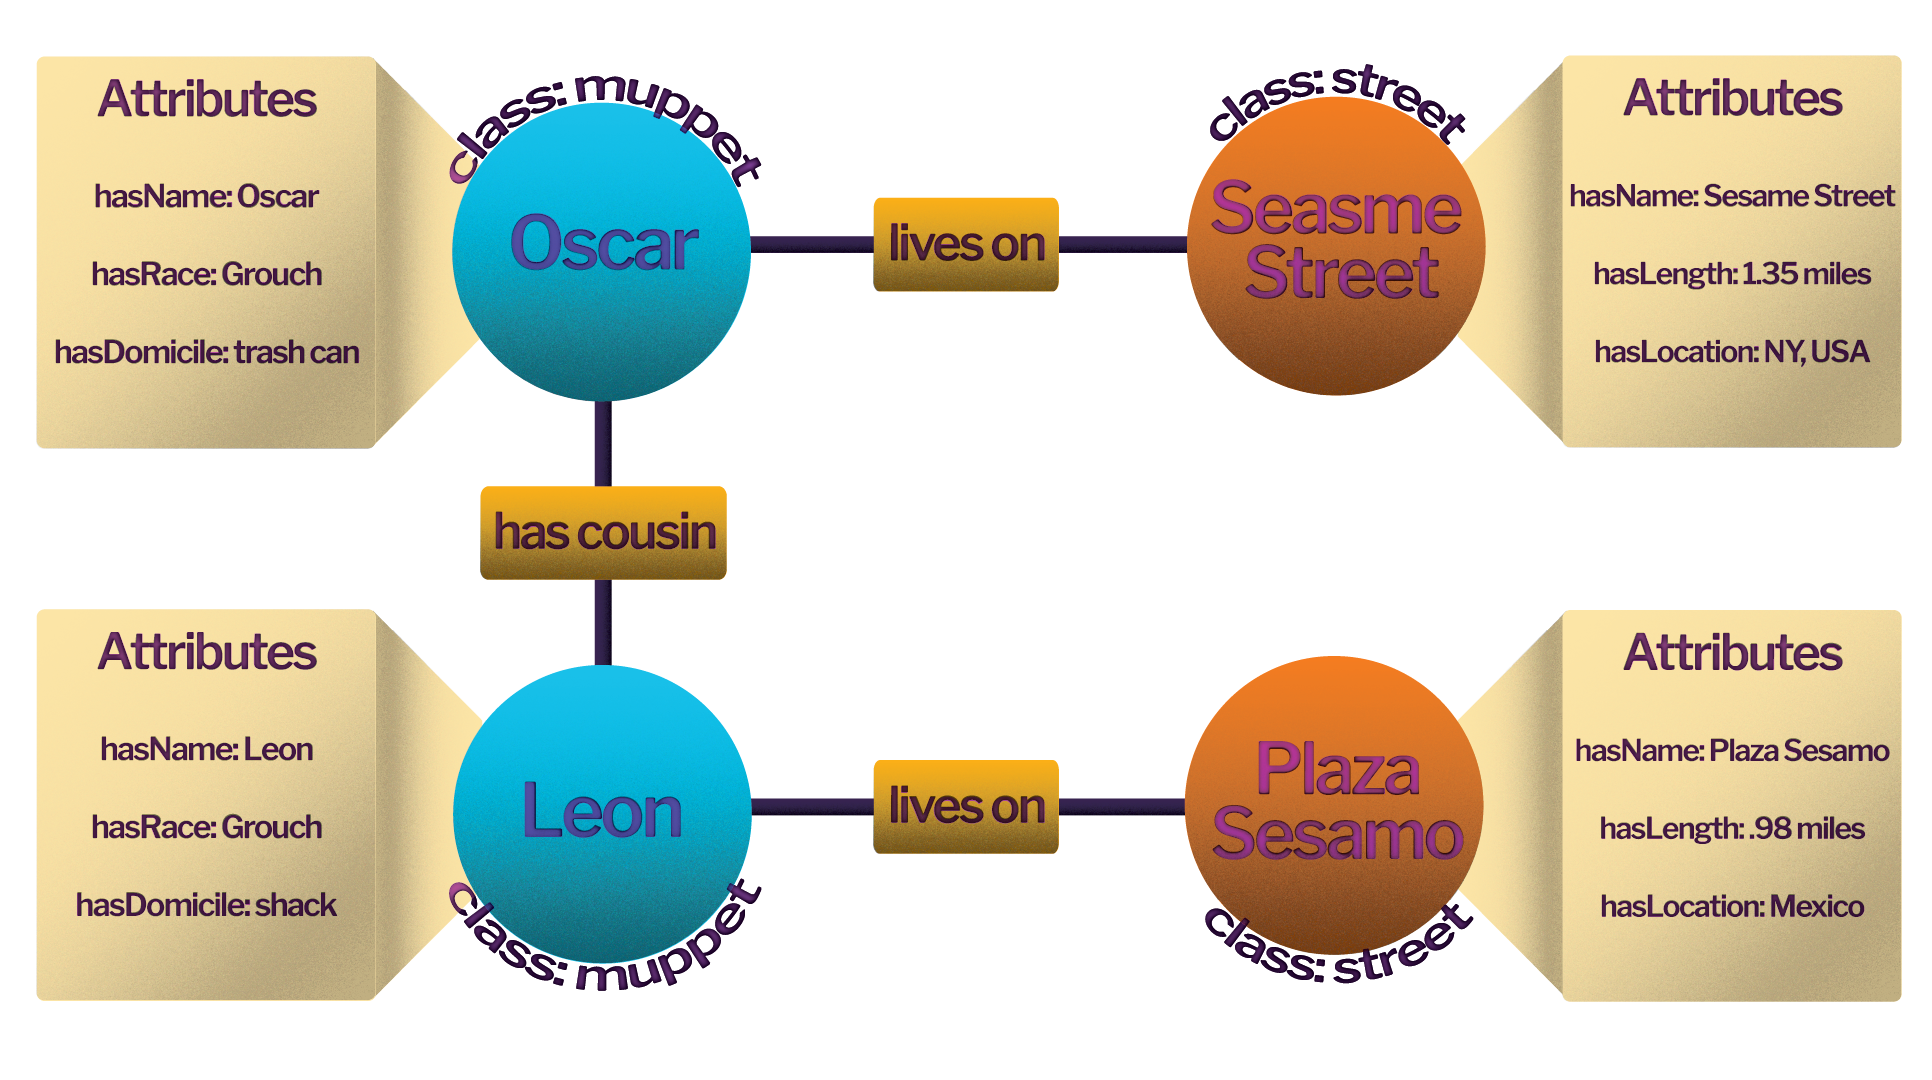
The knowledge graph enables machine inference of connections between entities that have not been directly linked with a relationship, so the database can serve results that are not necessarily obvious.

For example, the fact that Leon has a cousin who lives on Sesame Street is never explicitly encoded in the database, but the knowledge graph enables us to infer this fact.
This example may seem trivial, but this ability becomes more powerful as you can make relevant inferences between entities across many degrees of separation.
We will also have a spatial explorer to enable intuitive knowledge acquisition via a map-based user interface.
As a fictional and entertaining example: Say resource extraction was proposed near Sesame Street and Oscar wants information to help him understand who will be affected. Let's take a look at how he might do so.
Any object on the knowledge graph with a location or geographic features will have that information listed in its attribute table. These data can include point locations, boundary shapes, elevation, and more.
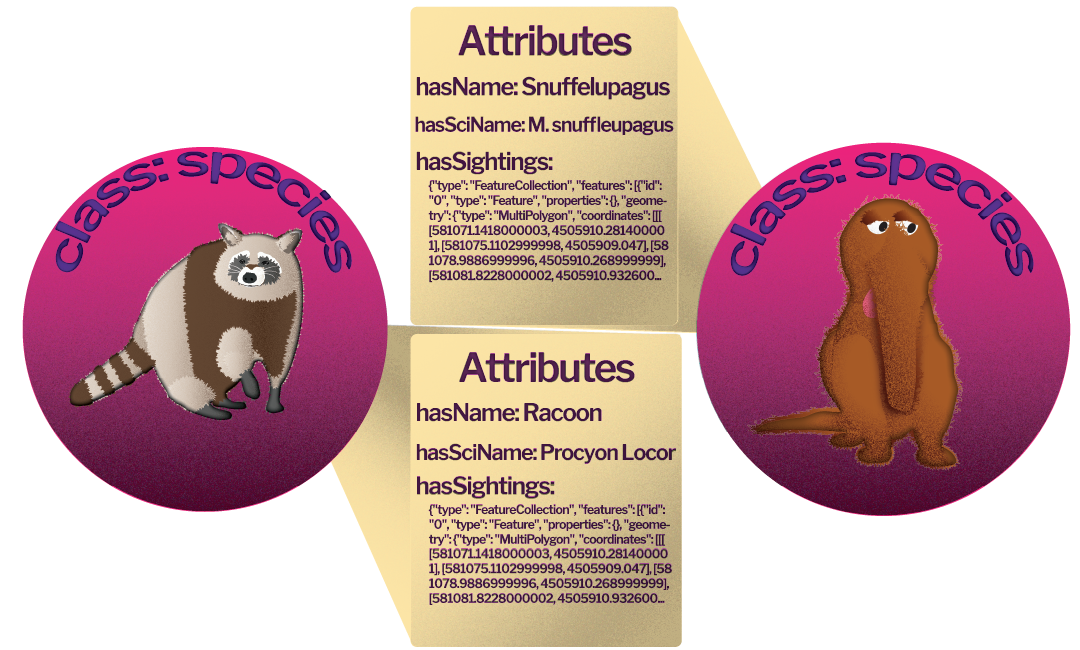
Species entities with point data "hasSightings"
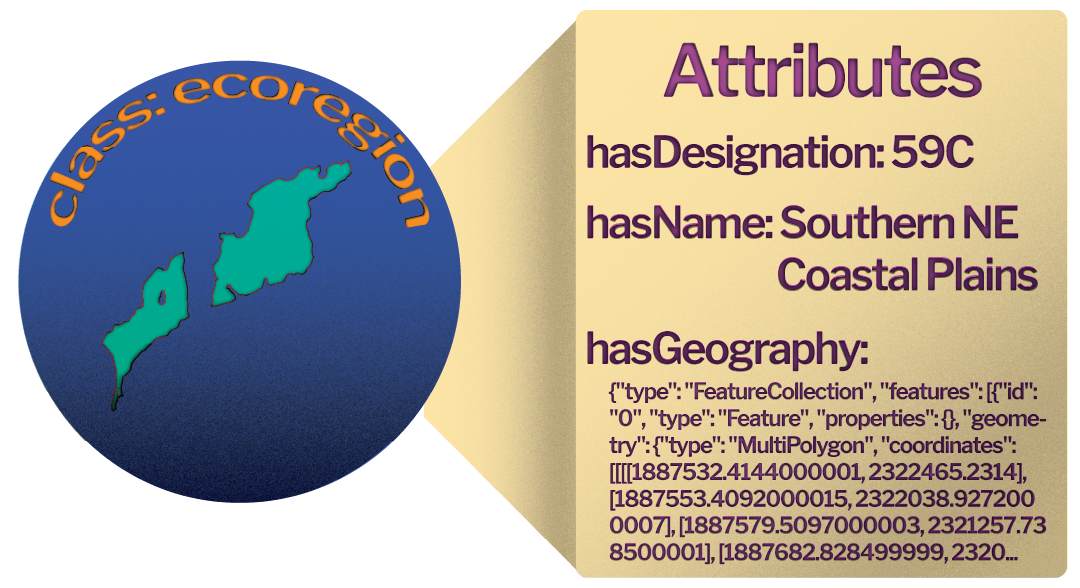
Ecoregion entity with shape data "hasGeography"
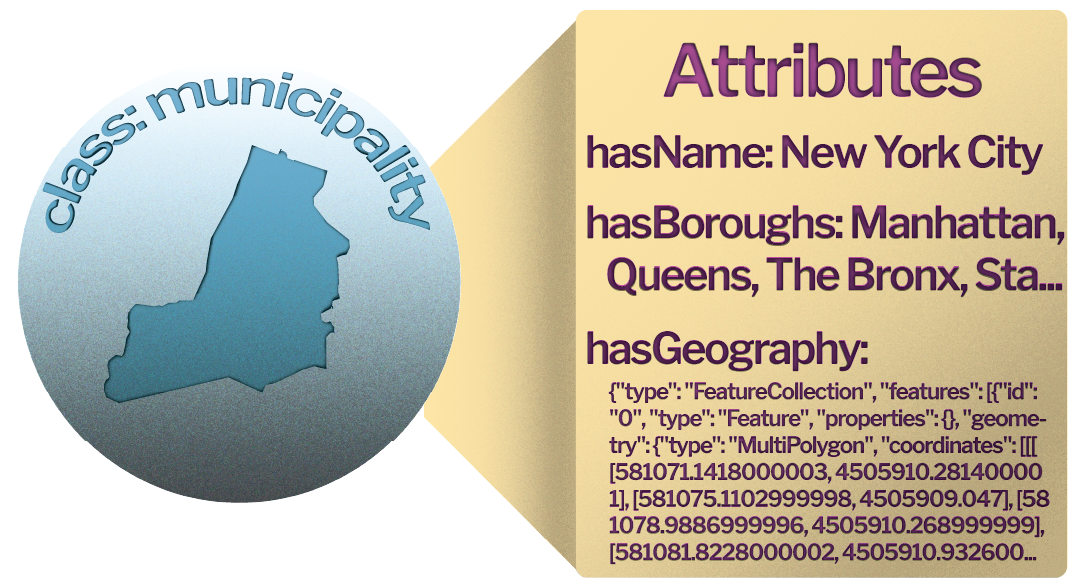
Municipality entity with shape data "hasGeography"
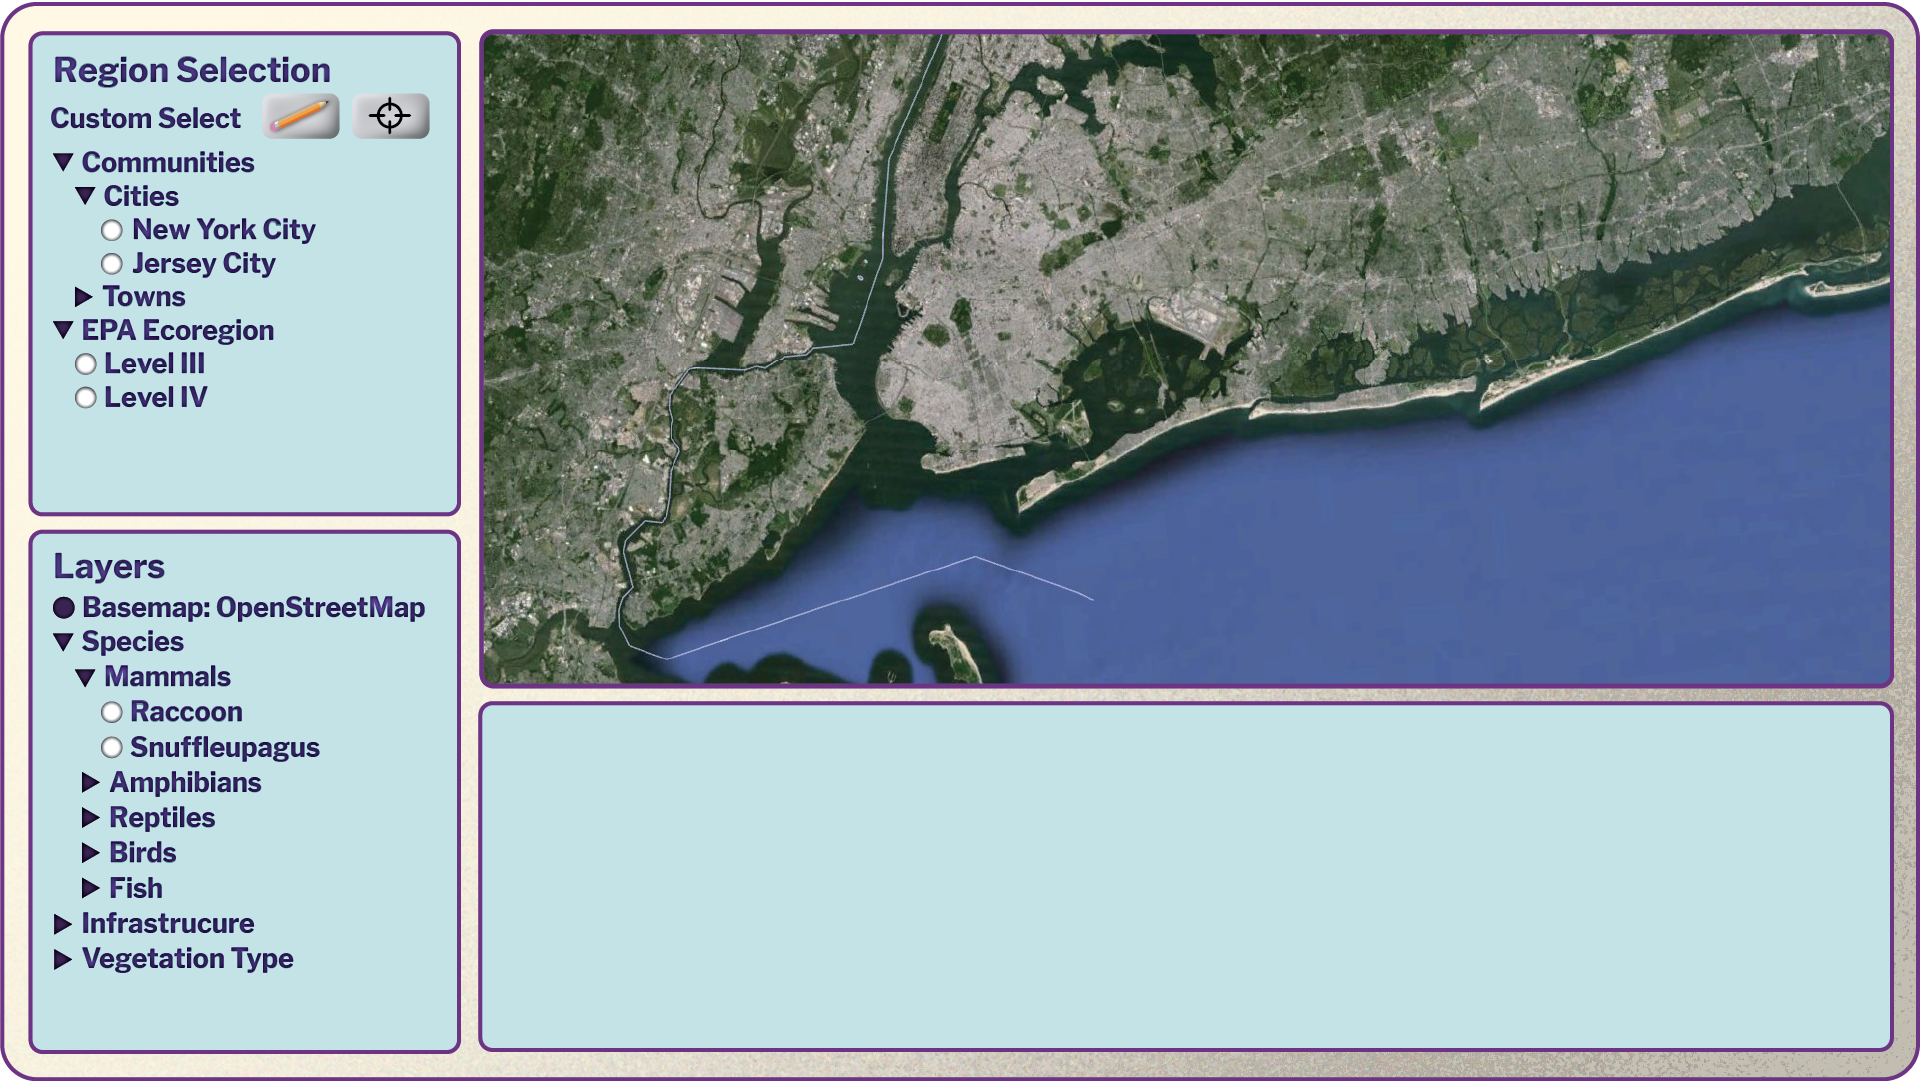
We know the location of the proposed mine, but because the proposal is so new, PanEcology doesn’t have data on it yet.
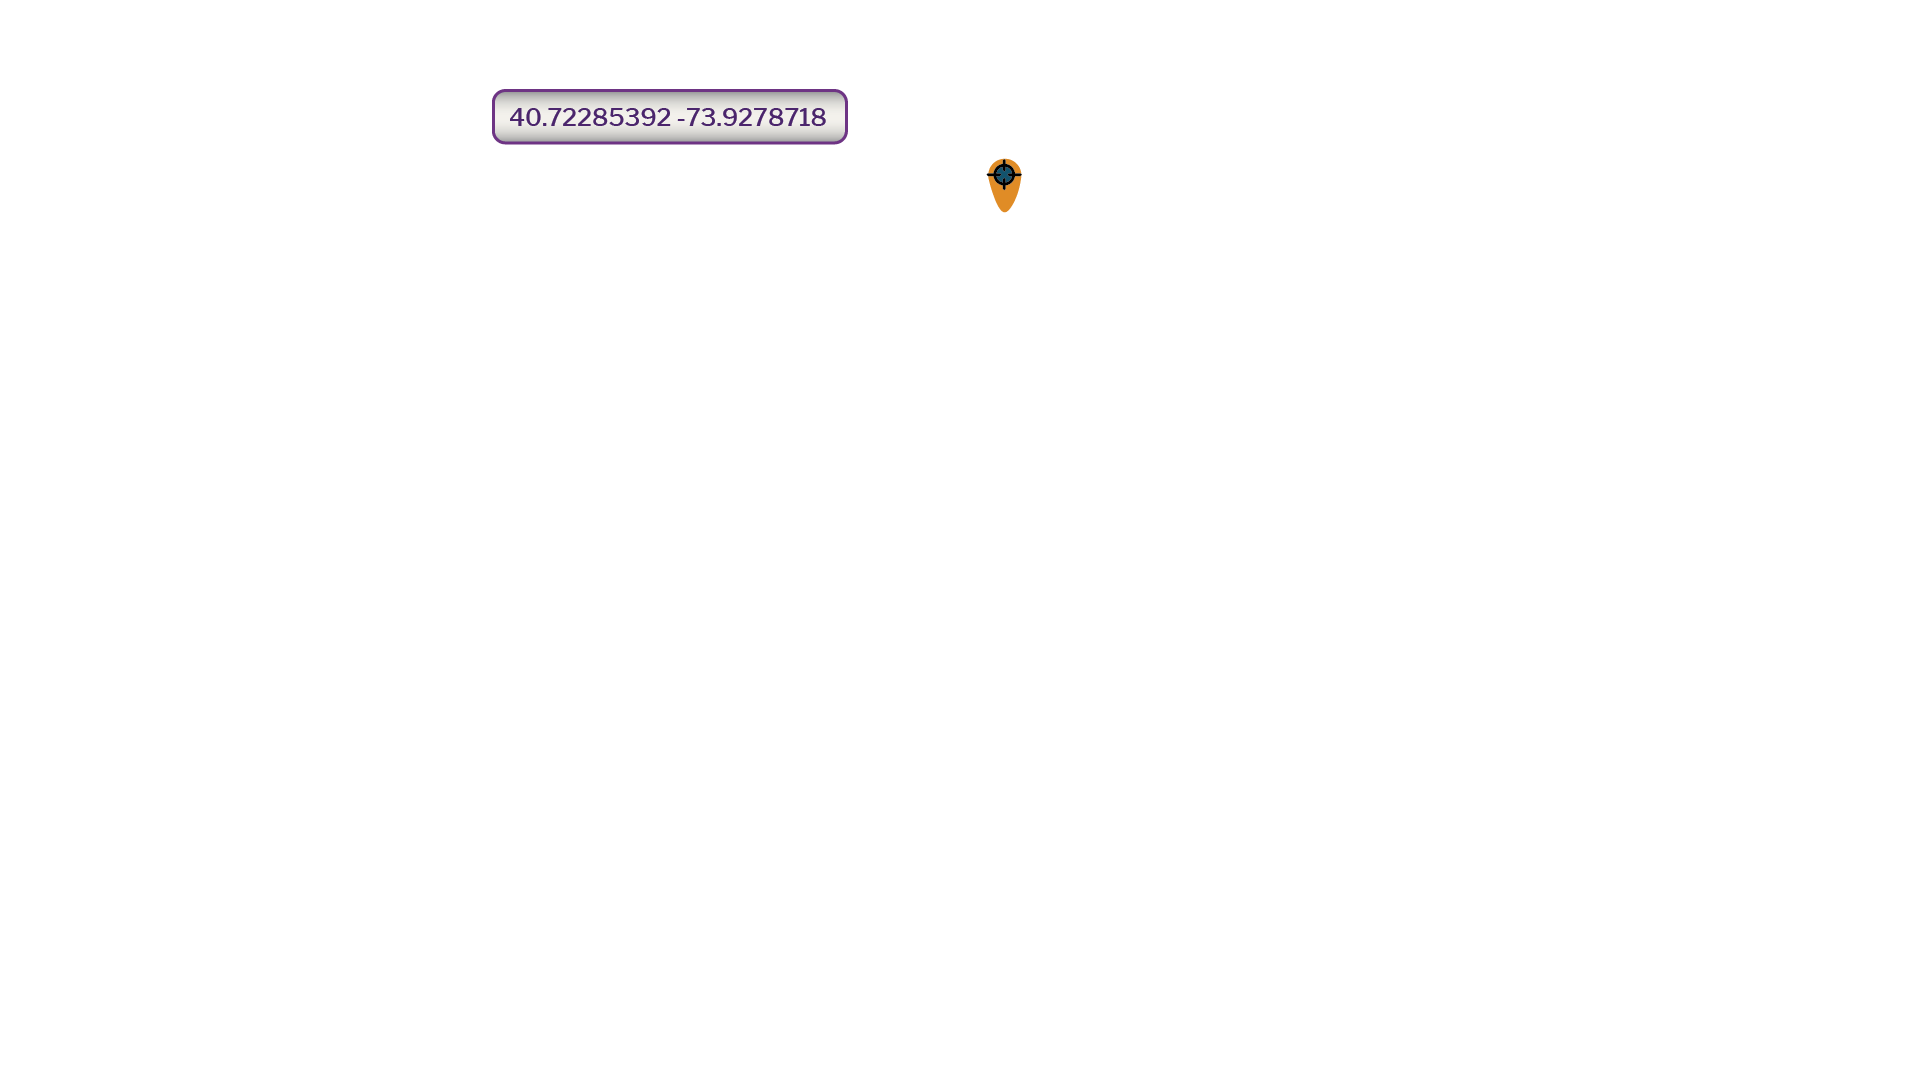
No worries! You can create a custom selection using either a drawn polygon or a point. We’ll use the point selection tool and drop a marker near the proposed mine location.
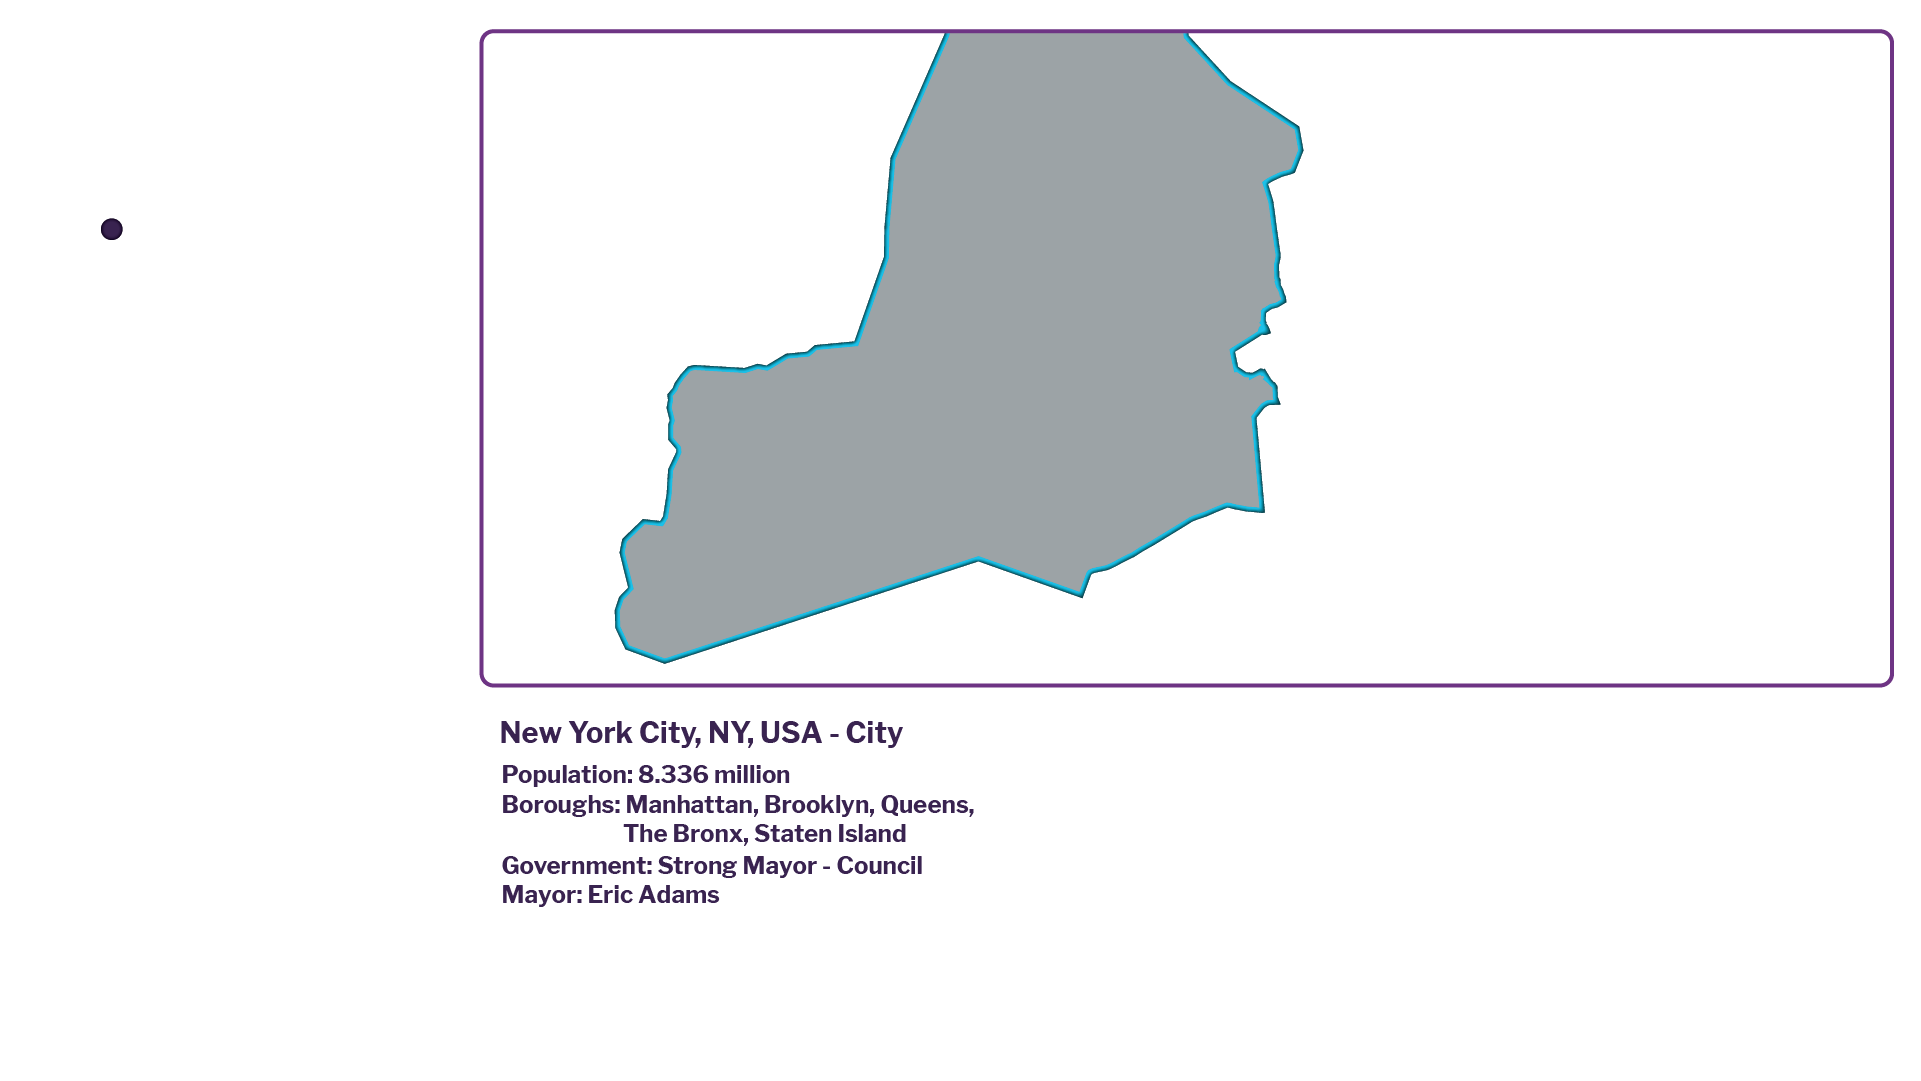
We know that Oscar lives on Sesame Street, and that Sesame Street is in New York City, so we enable the Cities layer and select New York. Now we can see the boundaries of New York, and in the info box at the bottom of the interface we are presented with basic information about the city. If we wished, we could click on that info to navigate through to the NYC wiki page, but for now we will continue our investigation on the map.
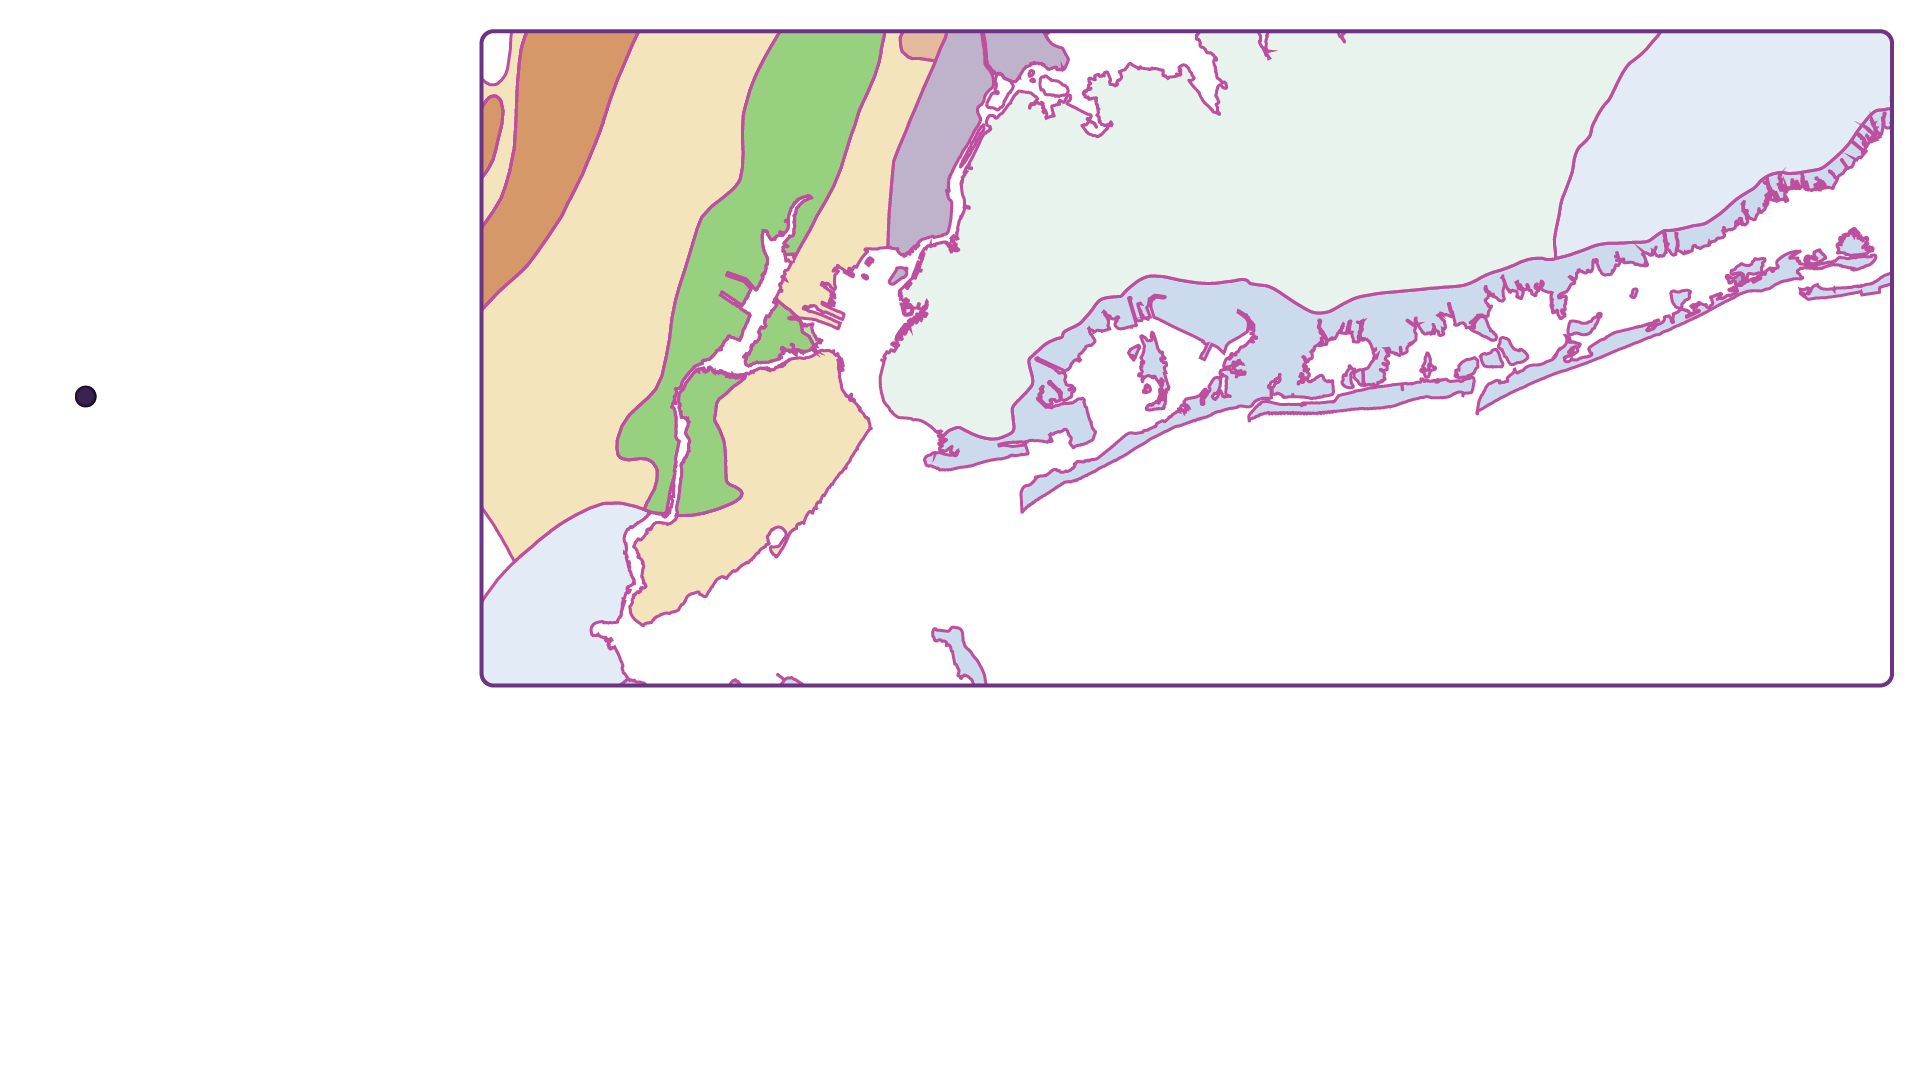
Now we’d like to get a sense of the ecological setting on and around Sesame Street. We've clicked on the Level 4 Ecoregions layer so we can get a sense of the region's nearby ecology.
We can click through and read about these ecoregions, learning that it’s been largely urbanized, but there is some nearby farmland and scattered woods we’d need to be careful not to disturb with our proposed project.
Now we’re curious about the direct impact on nearby wildlife.
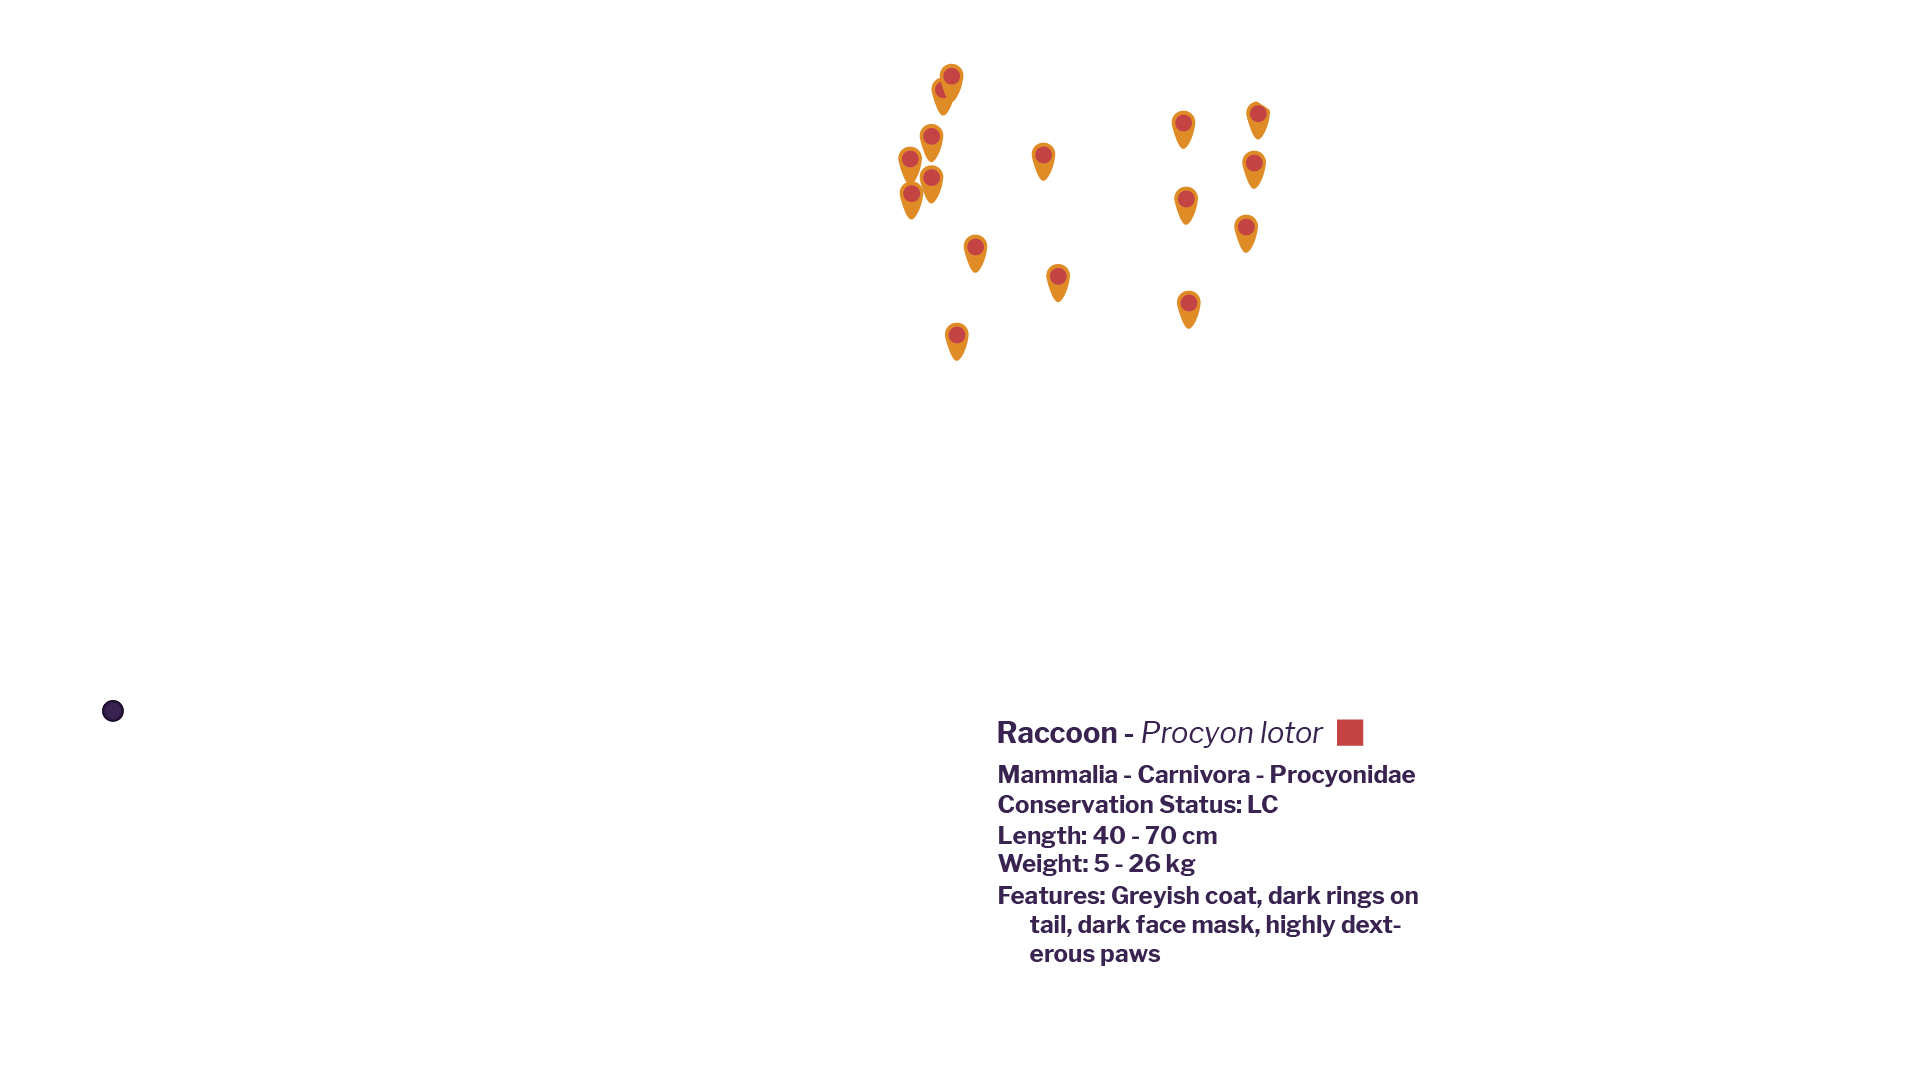
We use the Layers window to navigate to species info that will let us populate the region we've selected with sightings of the species of interest.
It looks like there are a lot of raccoons in the area, and they are pretty spread out.
We're looking for a creature that might be a bit more sensitive to a resource extraction project, so lets add another selction.
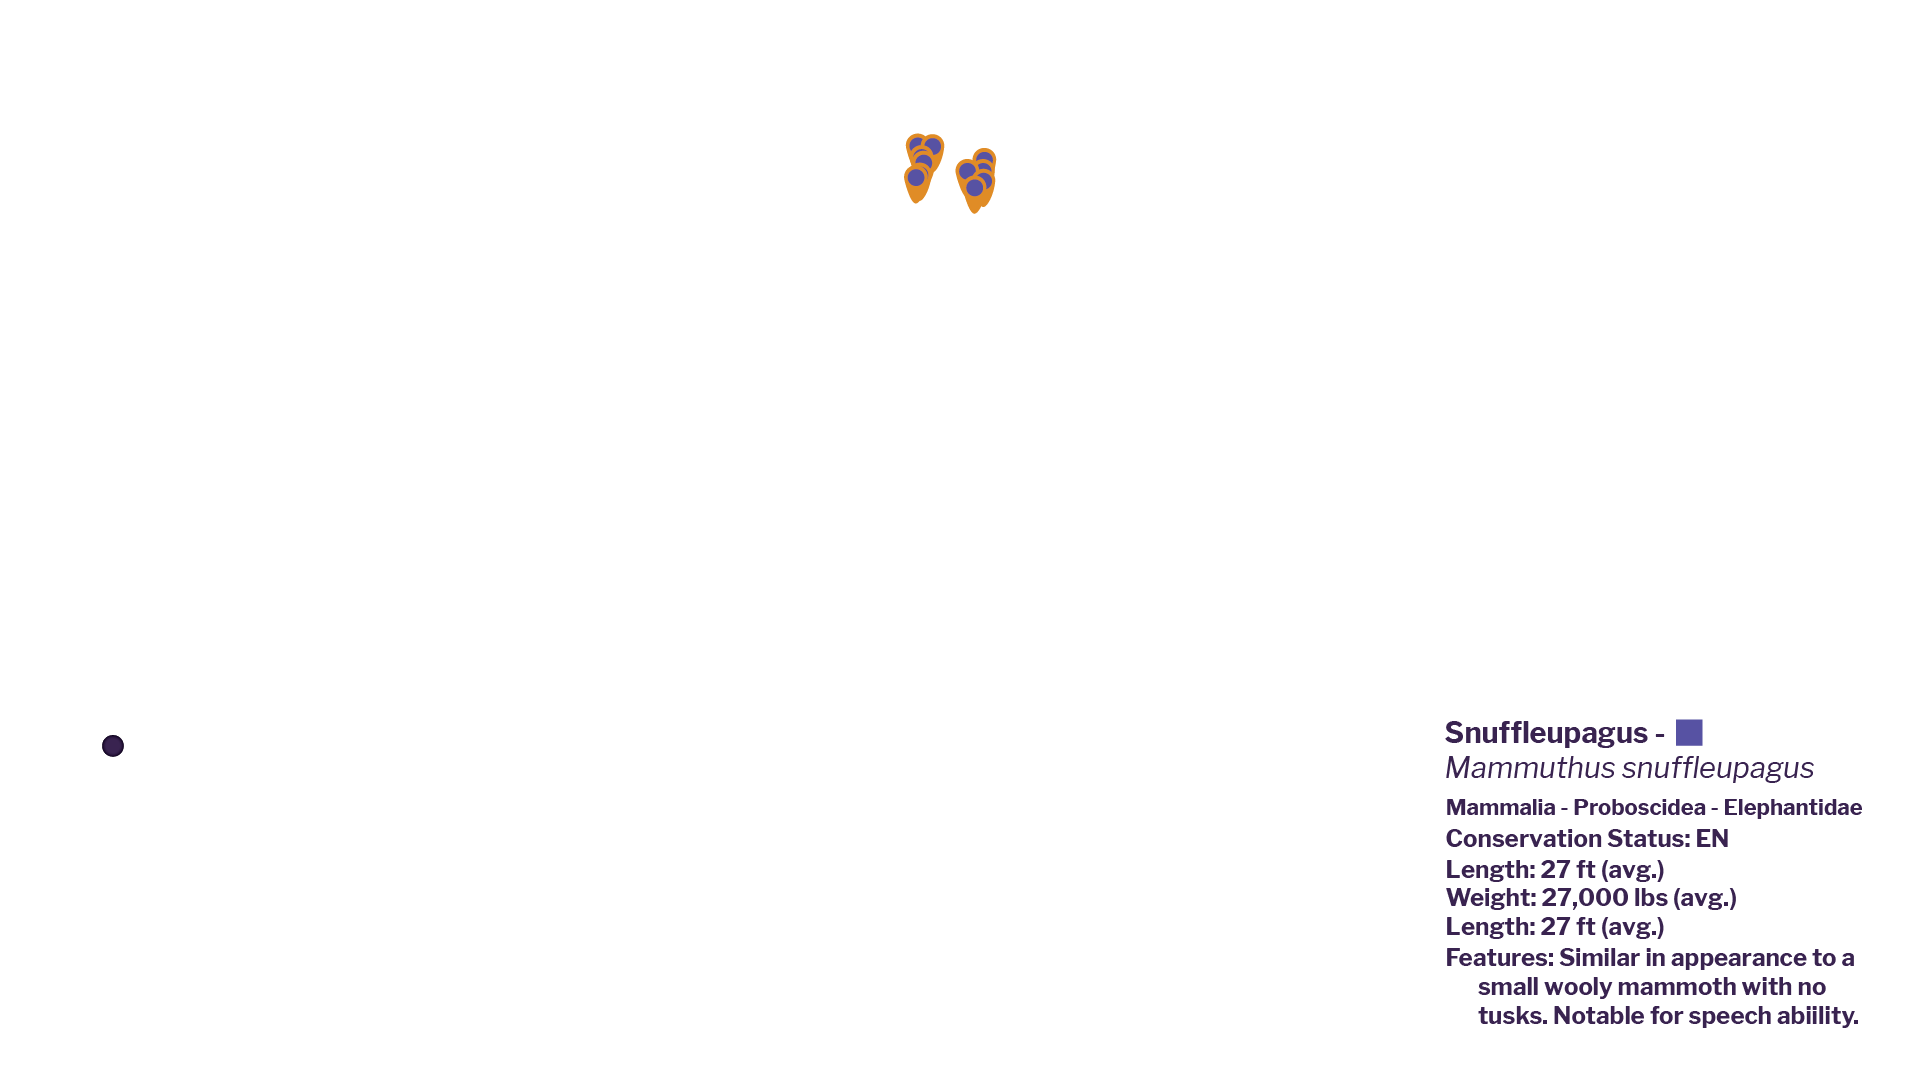
We figure Sunffleupagus would be a good bet, so we select the species from the Layers window. We're actually a little surprised to see that the Snuffleupagus' range is a bit bigger than expected — we thought there was only one and that he lived on Sesame Street!
We can click on any one of the sightings and find out more details about that particular sighting. We can also click through to the wiki page and discover that there are a number of Snuffleupagi, and that they all live in a cave just outside of Sesame Street.
It looks like our proposed project is very near to the Snuffleupagus family cave. This is definitely a potential problem, but with this new information, Oscar and his community can approach the extraction company and policy makers to figure out an alternative!
Support development of this service with a Patreon substription!